
Understanding how to monitor your entire Azure infrastructure from a single pane of glass, receive alerts when things go wrong, and use powerful query tools to troubleshoot issues all essential skills for an Azure Administrator.
Imagine you’re managing a dozen virtual machines, several web apps, and multiple storage accounts in Azure. Without proper monitoring, you’d have no idea when:
- A VM’s CPU is maxing out at 100%
- Your web app is returning 500 errors
- A database is running out of storage space
- Azure services in your region are experiencing issues
Azure Monitor and Log Analytics solve this problem by collecting telemetry data from all your resources, analyzing it, and alerting you before small issues become big problems.
The Real-World Scenario
You’re the cloud administrator for a growing e-commerce company. Your infrastructure includes:
- 3 virtual machines running your application
- Azure Storage for product images
- An Azure SQL database
- A web app frontend
Your boss wants to know immediately if anything goes wrong, but doesn’t want to be bombarded with false alarms. Let’s build this monitoring system step by step.
Understanding The Architecture
Azure has evolved significantly. The old Log Analytics agent is deprecated as of August 2024. Here’s what you need to know:
The New Approach: Azure Monitor Agent + Data Collection Rules
Azure Monitor now uses the Azure Monitor Agent (AMA), which replaced the legacy Log Analytics agent. The agent collects monitoring data from virtual machines and uses Data Collection Rules (DCRs) to specify what data to collect and where to send it.
Think of it like this:
- Azure Monitor Agent (AMA) = The worker that collects data from your VMs
- Data Collection Rules (DCRs) = Instructions telling the agent what to collect
- Log Analytics Workspace = The central warehouse where all data is stored
- Alert Rules = Automated watchers that notify you when thresholds are crossed
Understanding the Building Blocks
Before we dive into implementation, let’s demystify the key components:
1. Log Analytics Workspace
Think of this as your central data warehouse for logs. All your Azure resources send their diagnostic data here, application logs, performance metrics, security events, and more. Once centralized, you can search, analyze, and visualize this data.
Real-world analogy: It’s like a security control room where all camera feeds from different buildings come together on one wall of monitors.
2. Azure Monitor
This is the umbrella service that collects metrics and logs from your resources. It provides dashboards, visualizations, and insights into your infrastructure’s health and performance.
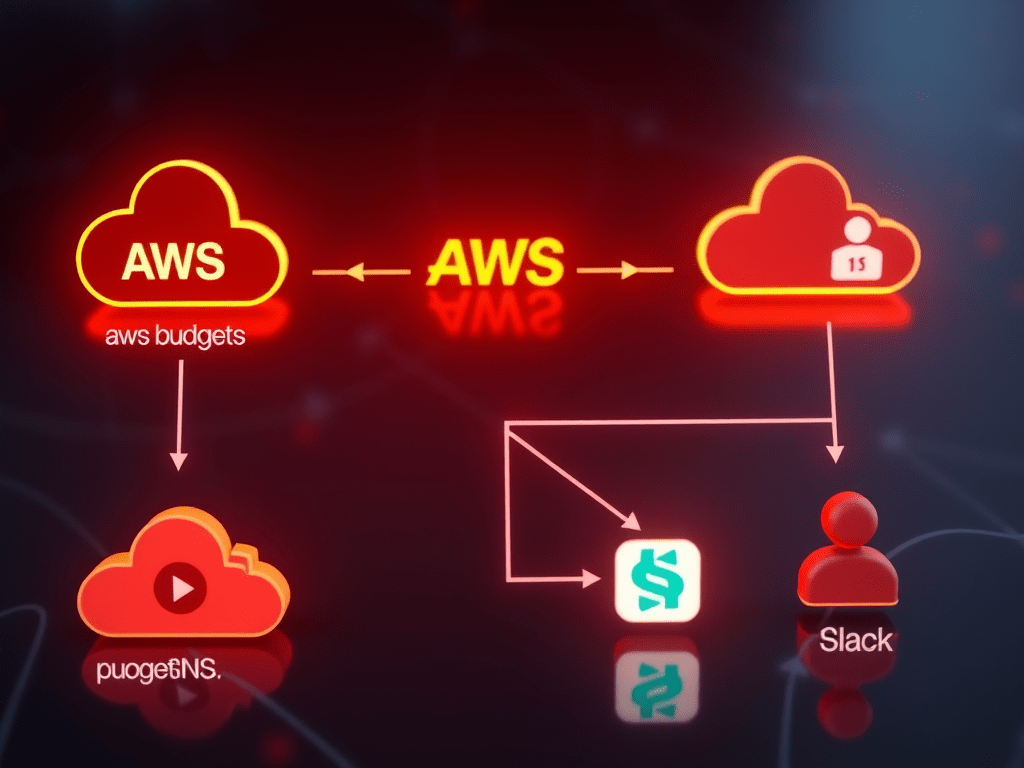
3. Alert Rules & Action Groups
Alert rules define what to watch for (e.g., “CPU usage exceeds 80% for 5 minutes”), while action groups define what to do when that condition is met (e.g., send an email to the ops team, trigger a webhook to auto-scale).
4. VM Insights
A specialized monitoring solution that gives you deep visibility into virtual machine performance, including CPU, memory, disk I/O, and network traffic. It also shows dependencies between VMs and other resources.
5. Application Insights
Similar to VM Insights but for web applications. It tracks request rates, response times, failure rates, and user behavior patterns.
6. Azure Monitor Agent (AMA)
The agent is installed on VMs running in Azure, other clouds, or on-premises, providing access to local logs and performance data. It can be installed on a single machine or at scale using Azure Policy or other tools.
What changed: The new AMA uses DCRs for all configuration, making it more flexible and manageable than the old agent.
7. Data Collection Rules (DCRs)
DCRs are part of an ETL-like data collection process that provides a consistent method for configuring different data sources, the ability to apply transformations to filter or modify incoming data, and scalable configuration options supporting infrastructure as code.
Why they’re better: DCRs separate configuration from deployment. You define what to collect once, then associate that rule with multiple VMs.
Step 1: Create Your Log Analytics Workspace
This is where all your monitoring data lives. Let’s set it up properly.
Why We Do This First
You need the workspace created before connecting resources to it. Think of it like setting up the filing cabinet before you can start filing documents.
How to Create It
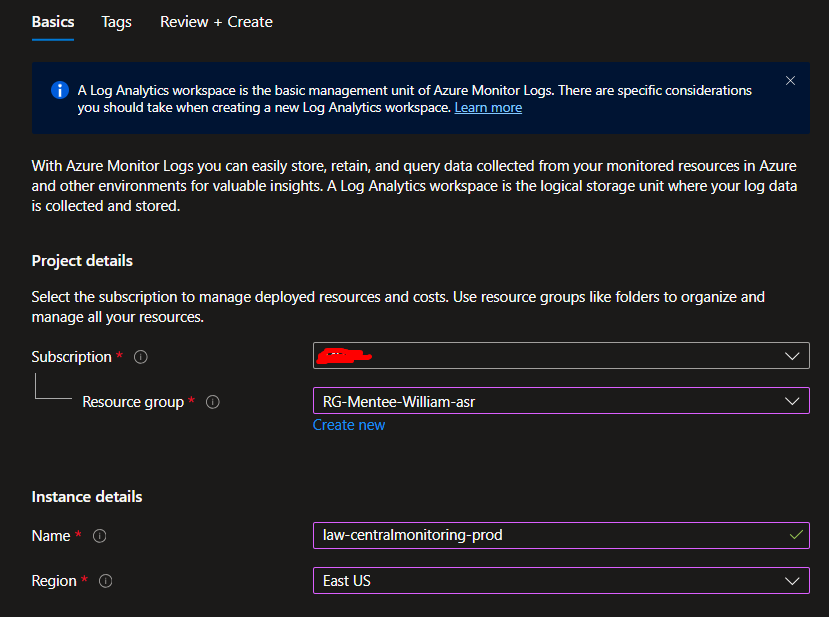
Navigate to the Azure Portal and search for “Log Analytics workspaces” in the top search bar, then click Create.
Fill in the basics with these best practices in mind:
- Subscription: Choose your subscription
- Resource Group: Use existing or create a new one called
rg-monitoring(keeping monitoring resources separate is a good practice) - Name: Use something descriptive like
law-centralmonitoring-prod(law = Log Analytics Workspace) - Region: Choose the same region as most of your resources (reduces latency and costs)
Pricing tier will default to Pay-as-you-go, which is perfect for learning. You only pay for data ingested (typically pennies per GB for testing).
Click Review + Create, then Create. This takes about 30 seconds.
What Just Happened?
Azure created a workspace with a unique identifier. Resources will now be able to send their logs here using this workspace’s connection string.
Step 2: Connect Your Virtual Machines
Now let’s teach your VMs to report their health data to the workspace.
Azure recently introduced Azure Monitor Agent (AMA), which replaces the older Log Analytics Agent. Here’s how to use it:
Navigate to your VM in the Azure Portal. Go to the VM you want to monitor and find the Monitoring section in the left menu, then click Insights.
Enable VM Insights by clicking the “Enable” button. You’ll see a configuration panel. Select your Log Analytics workspace (law-centralmonitoring-prod) and choose Azure Monitor Agent (not the legacy agent).
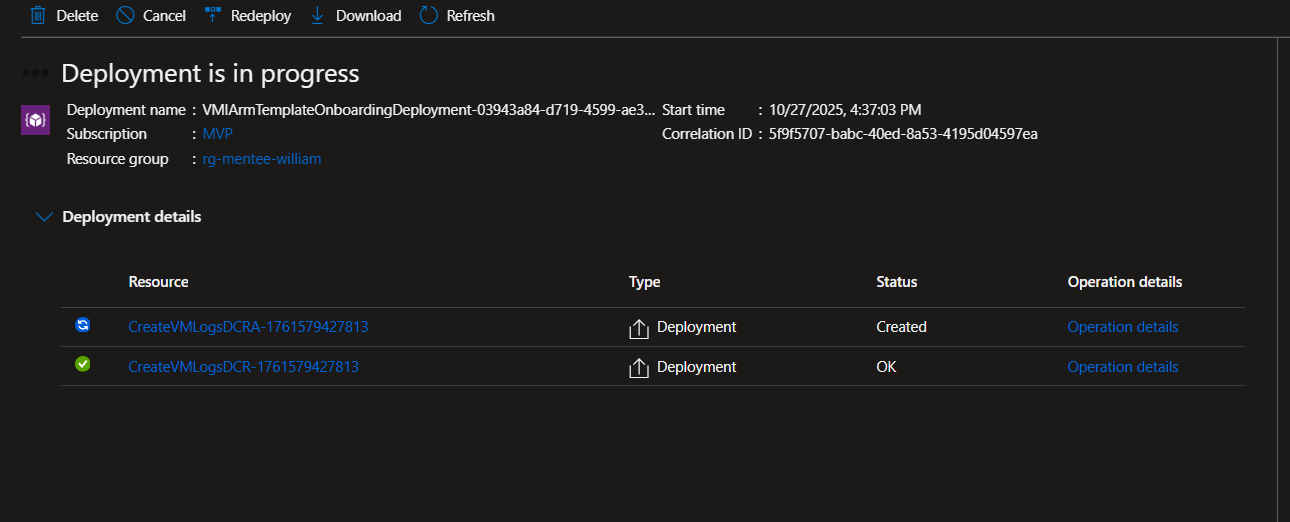
Configure data collection by creating a Data Collection Rule (DCR). This tells Azure what data to collect. For beginners, choose the “Performance Counter” template, which includes CPU, memory, disk, and network metrics.
Deploy and wait about 5 minutes. Azure is installing the monitoring agent on your VM and configuring the data pipeline.


Do This for Each VM
Repeat this process for all VMs you want to monitor. Pro tip: For production environments with many VMs, you can use Azure Policy to automatically enable monitoring on all VMs.
Step 3: Enable Deep VM Monitoring with VM Insights
VM Insights gives you superpowers beyond basic metrics. Let’s unlock them.
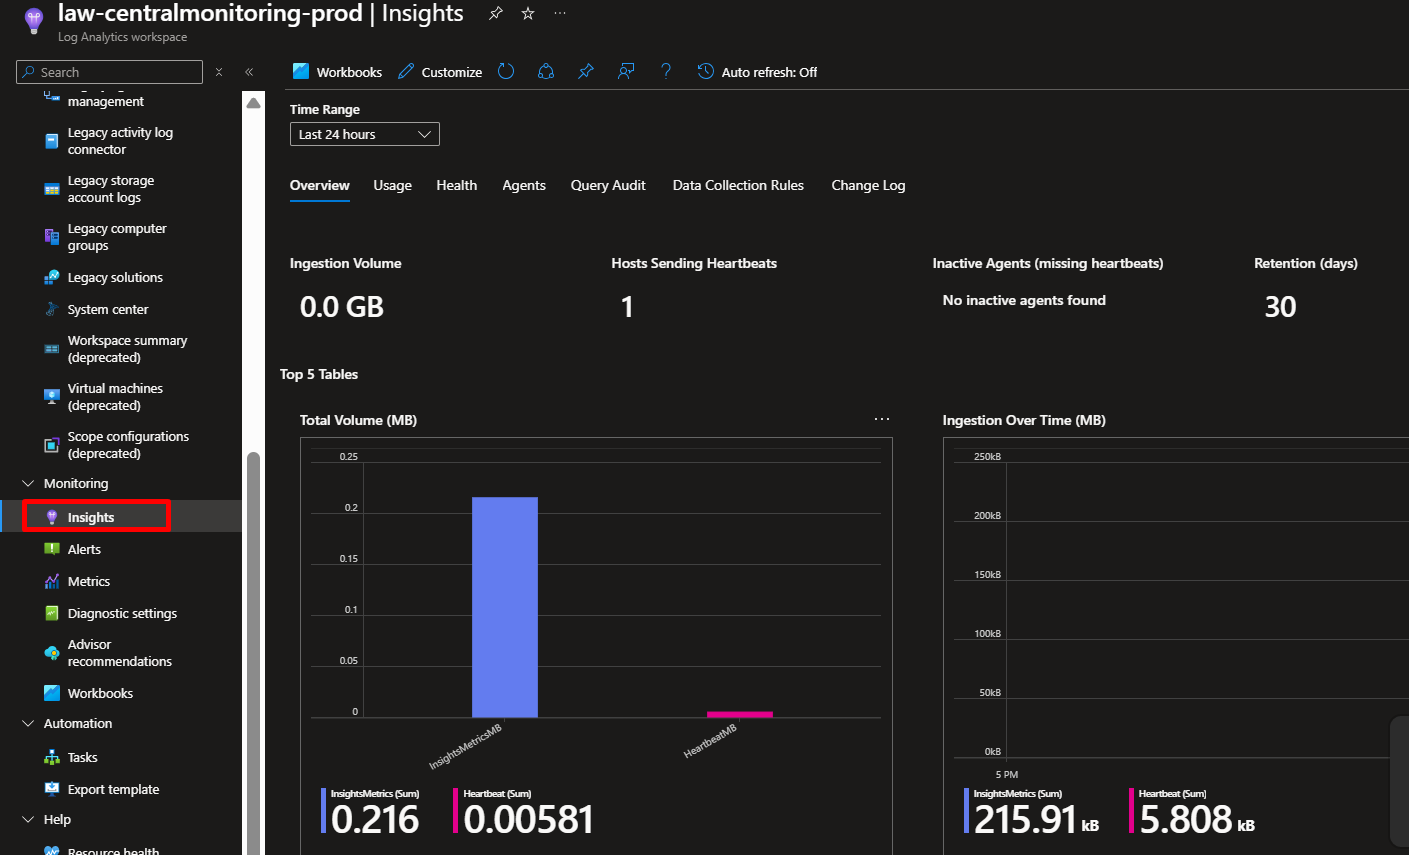
From your Log Analytics workspace, click Insights under the Monitoring section, then select Virtual Machines. You’ll see a list of your VMs. The ones you configured earlier should show as “Monitored.”
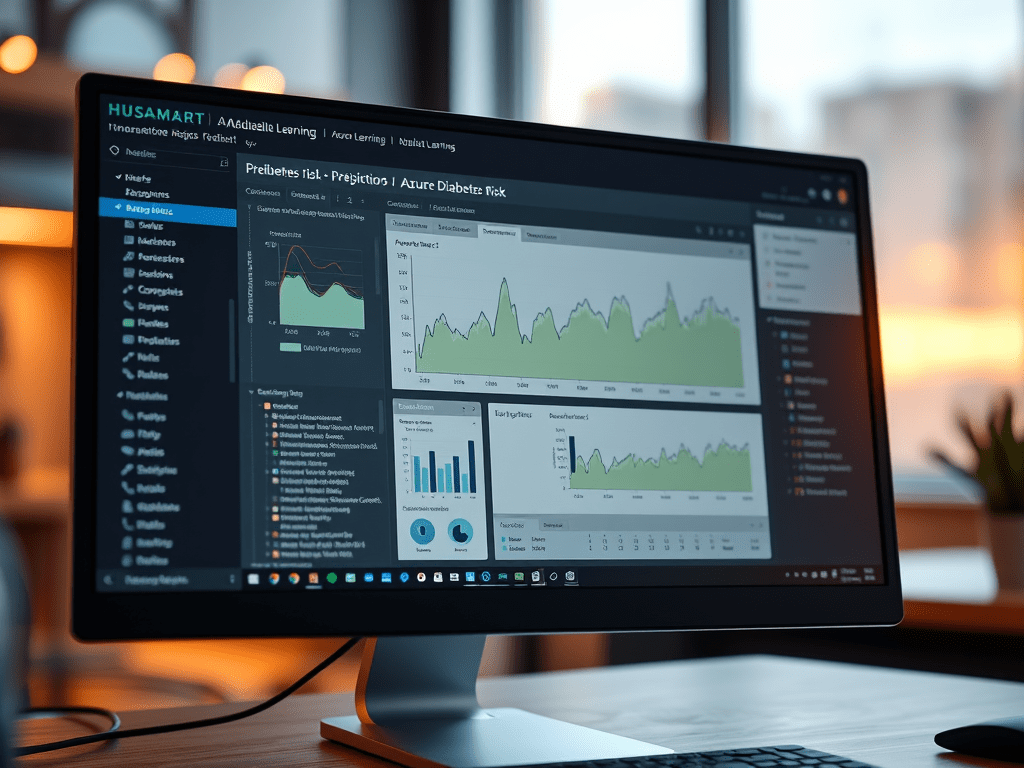
Explore the Performance tab to see real-time CPU, memory, disk, and network usage across all your VMs in beautiful charts. You can change time ranges (last hour, last 24 hours, last 7 days) to spot trends.
Check the Map tab which shows you the dependencies between your VMs and other resources. This is incredibly useful for troubleshooting. If your web server talks to a database, you’ll see that connection visualized.
What Makes This Powerful
Instead of logging into each VM individually to check performance, you now have a single pane of glass showing everything. You can compare performance across VMs, spot outliers, and identify resource bottlenecks in seconds.
Step 4: Create Your First Alert Rule
Here’s where monitoring becomes proactive. Let’s create an alert for high CPU usage.
Navigate to Azure Monitor by searching for “Monitor” in the top search bar. Click Alerts in the top menu, then click Create and choose Alert rule.


Select your resource by clicking “Select resource.” Choose one of your VMs, then click Done.
Define the condition by clicking “Add condition.” In the signal list, search for and select All Administrative operations.
Configure the threshold:
- Threshold: Static
- Aggregation type: Average
- Operator: Greater than
- Threshold value: 80
- Check every: 1 minute
- Lookback period: 5 minutes
This means: “Alert me if average CPU is above 80% for 5 continuous minutes, checking every minute.”
Why these settings? We use a 5-minute lookback to avoid alerting on temporary spikes (like during Windows updates). Checking every minute ensures fast detection.
Click Done.
Best Practices for Alert Thresholds
- CPU: 80% for production, 90% for dev/test
- Memory: 75% for production, 85% for dev/test
- Disk space: Alert at 80% full (gives you time to act)
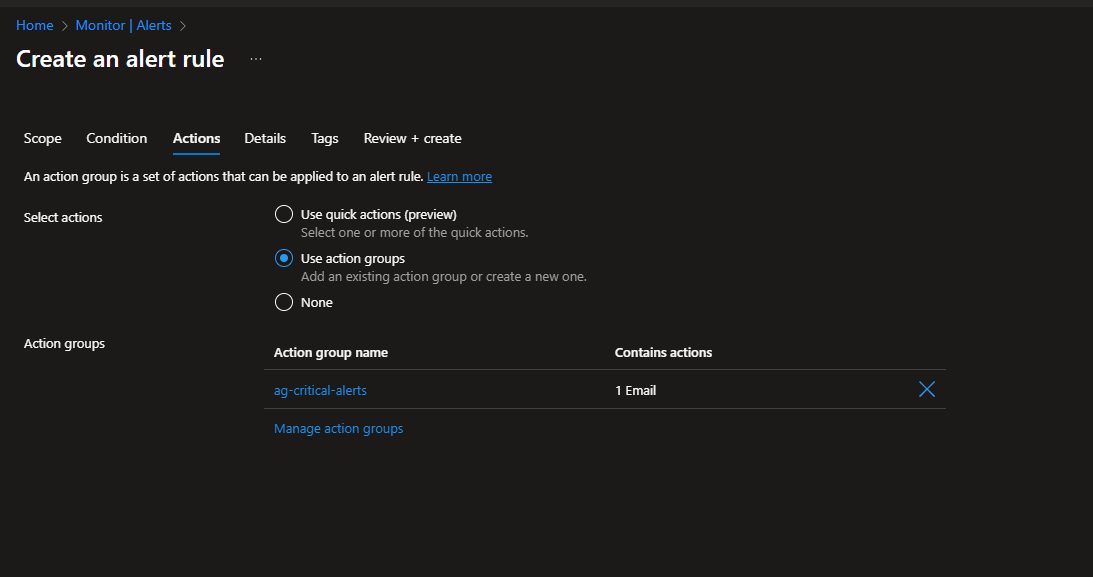
We’ll connect this to an Action Group in the next step.
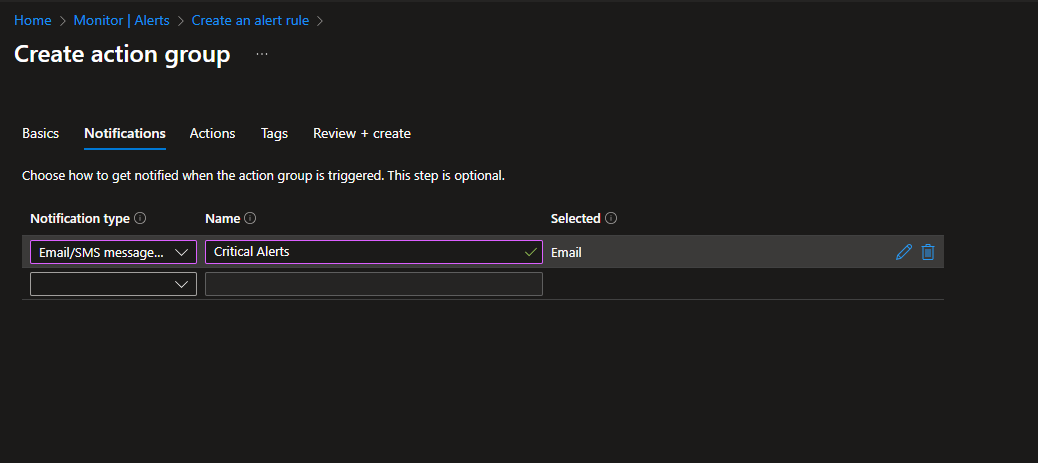
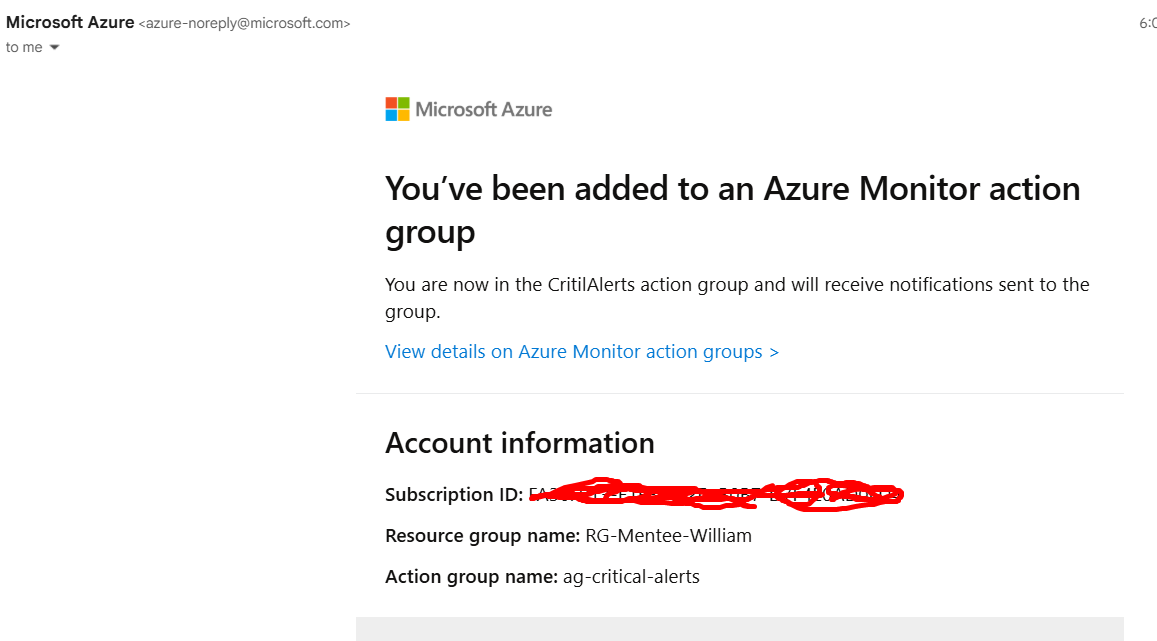
Step 5: Create an Action Group (Your Notification System)
Alert rules tell Azure when to alert. Action Groups tell Azure how to alert. Let’s create one.
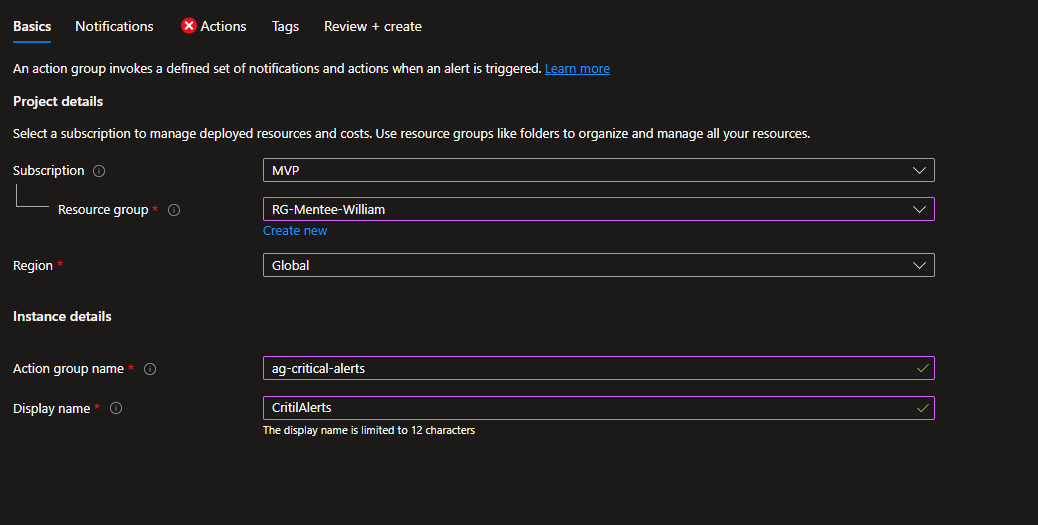
While still creating your alert rule, scroll to the Actions section and click Create action group.
Fill in the basics:
- Subscription: Your subscription
- Resource Group: Use your
rg-monitoringresource group - Name:
ag-critical-alerts - Display name: Critical Alerts (shown in notifications)
Add notifications. Click the Notifications tab. Choose notification type: Email/SMS message/Push/Voice. Enter a name like “Ops Team” and add your email address. Optionally add your phone number for SMS (great for critical alerts).
Add actions (optional). You can trigger webhooks, run Azure Functions, create IT service management tickets, and more. For beginners, email is perfect. For advanced setups, you might trigger an Azure Automation runbook to automatically scale up the VM.
Click Review + Create, then Create.
Finish creating your alert rule. Back in the alert rule creation, scroll to Details and give your alert a name like “High CPU Alert – Production VMs” and a description. Set severity to 2 (Warning) or 1 (Error) depending on criticality.
Click Create alert rule.
Exam Tips for AZ-104
This project covers these exam objectives directly:
Monitor and maintain Azure resources: Know how to create alert rules, action groups, and dashboards. Understand the difference between Azure Monitor and Log Analytics.
Implement and manage storage: Be able to monitor storage account metrics like availability, latency, and capacity.
Deploy and manage compute resources: Understand VM monitoring with Azure Monitor Agent and VM Insights.
Key concepts to memorize:
- Data Collection Rules control what data is collected
- Alert rules have conditions, action groups define responses
- KQL is used to query logs in Log Analytics
- VM Insights requires Azure Monitor Agent
Practice scenario questions: “A company wants alerts when VM CPU exceeds 90% for 10 minutes, sent to the ops team. What components do you need?” (Answer: Alert rule with CPU metric condition, action group with email notification)


Leave a comment