Series context: This is the Part 2 of AKS autoscaling series. In Part 1 we built a Node.js loan calculator API, deployed it to AKS, and set up HPA and VPA. This post picks up from that same cluster and app. If you’re starting fresh, the prerequisites section has you covered.
Who this is for: Developers and DevOps engineers who understand HPA (scaling on CPU/memory) and want to go further, scaling on real business signals like queue depth, HTTP traffic, or custom metrics.
Why HPA Isn’t Always Enough
HPA is great at answering the question: “Is my app under CPU or memory pressure right now?” But many real-world scaling decisions should be driven by different signals entirely:
- A payment processing service should scale when its Azure Service Bus queue fills up, not after CPU spikes (by then, messages are already waiting too long)
- A loan approval API should scale when incoming HTTP requests per second climbs not when pods are already struggling
- A fraud detection service should scale based on a Prometheus metric like active transaction rate a business signal, not an infrastructure one
This is the gap KEDA fills. KEDA acts as a metrics adapter for the HPA. It uses “Scalers” to connect to an event source and monitors the source, for example, the number of messages in a queue, then exposes that metric to the HPA, which makes the scaling decision.
KEDA’s killer feature over standard HPA: scale to zero. When there are no events, KEDA can take your deployment all the way down to 0 pods, and bring the first pod up the moment an event arrives. You can’t do that with CPU-based HPA.
KEDA doesn’t replace HPA; it supercharges it. Under the hood, KEDA creates and manages an HPA object for you, feeding it custom metrics from whatever event source you configure.
Prerequisites
- The AKS cluster from Part 1 (or any AKS cluster with
kubectlconfigured) - The loan-api deployment running (
kubectl get deployment loan-api) - Azure CLI logged in (
az login) - The same environment variables set:
RESOURCE_GROUP="loan-api-rg"AKS_CLUSTER="loan-api-aks"
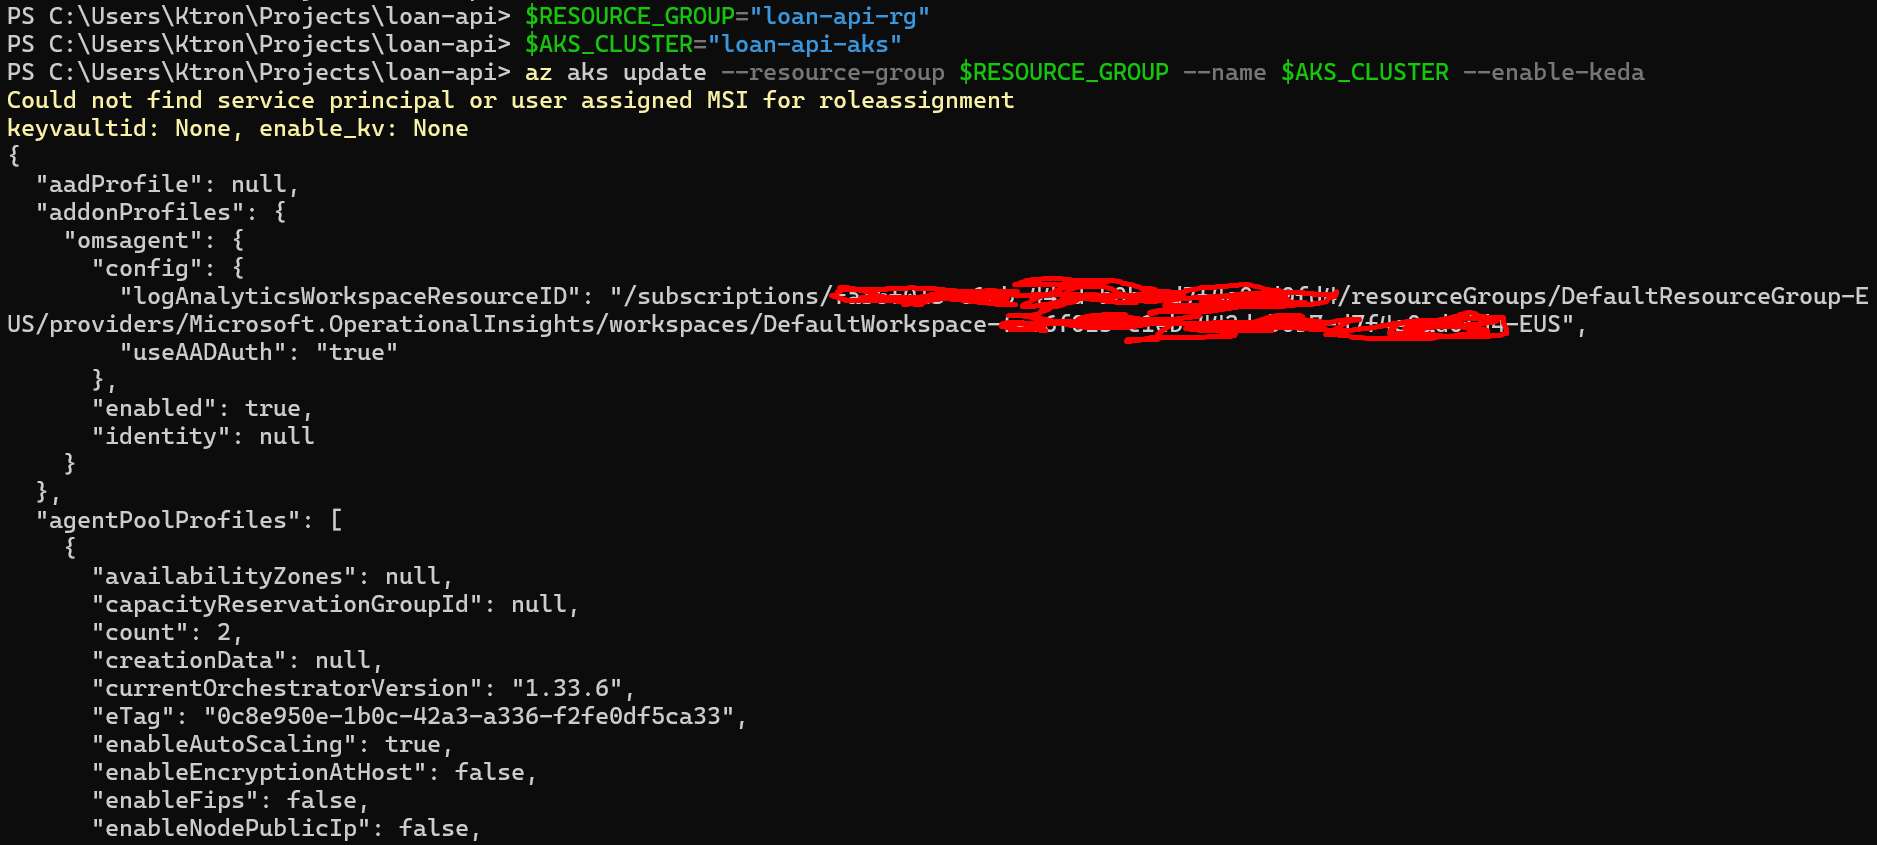
Step 1: Enable KEDA on Your AKS Cluster
KEDA is a fully managed AKS add-on, with no Helm chart to maintain, no CRDs to manage manually.
az aks update --resource-group $RESOURCE_GROUP --name $AKS_CLUSTER --enable-keda
This takes about 2 minutes. Verify the KEDA pods are running:
kubectl get pods -n kube-system | grep keda
keda-admission-webhooks-abc123-xxxxx 1/1 Running 0 90skeda-admission-webhooks-abc123-yyyyy 1/1 Running 0 90skeda-operator-def456-aaaaa 1/1 Running 0 90skeda-operator-def456-bbbbb 1/1 Running 0 90skeda-operator-metrics-apiserver-xxx 1/1 Running 0 90skeda-operator-metrics-apiserver-yyy 1/1 Running 0 90s
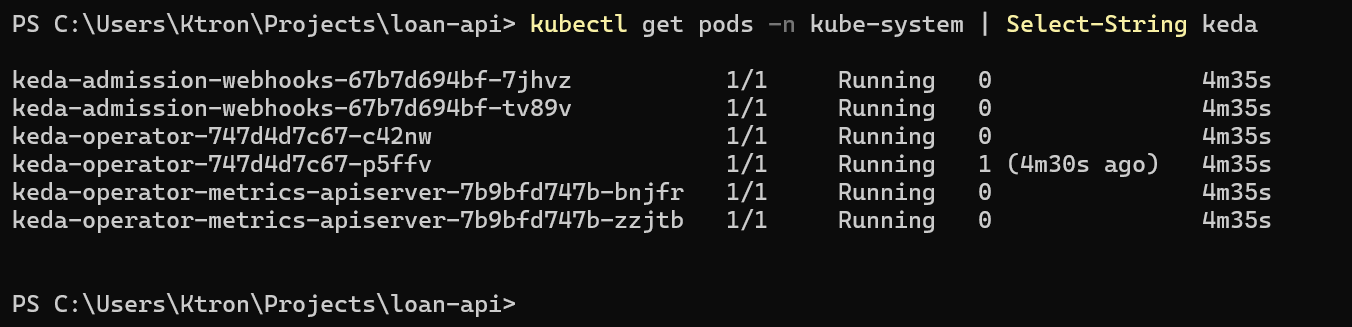
You’ll see pairs of pods, KEDA runs its components in HA (high availability) mode by default as a managed add-on.
Confirm the version installed:
kubectl get crd/scaledobjects.keda.sh -o jsonpath='{.metadata.annotations.keda\.sh\/version}'

Scaler 1: Azure Service Bus Queue
The Scenario
Our fintech startup has a new feature: when a customer submits a loan application on the website, it’s dropped into a Service Bus queue. A separate loan-processor Deployment picks up applications and runs background credit checks, an async, CPU-intensive job.
The right scaling signal here isn’t CPU. It’s the queue depth. If 500 applications pile up, we want 50 processor pods. If the queue is empty, we want 0 pods (why pay for idle workers?).
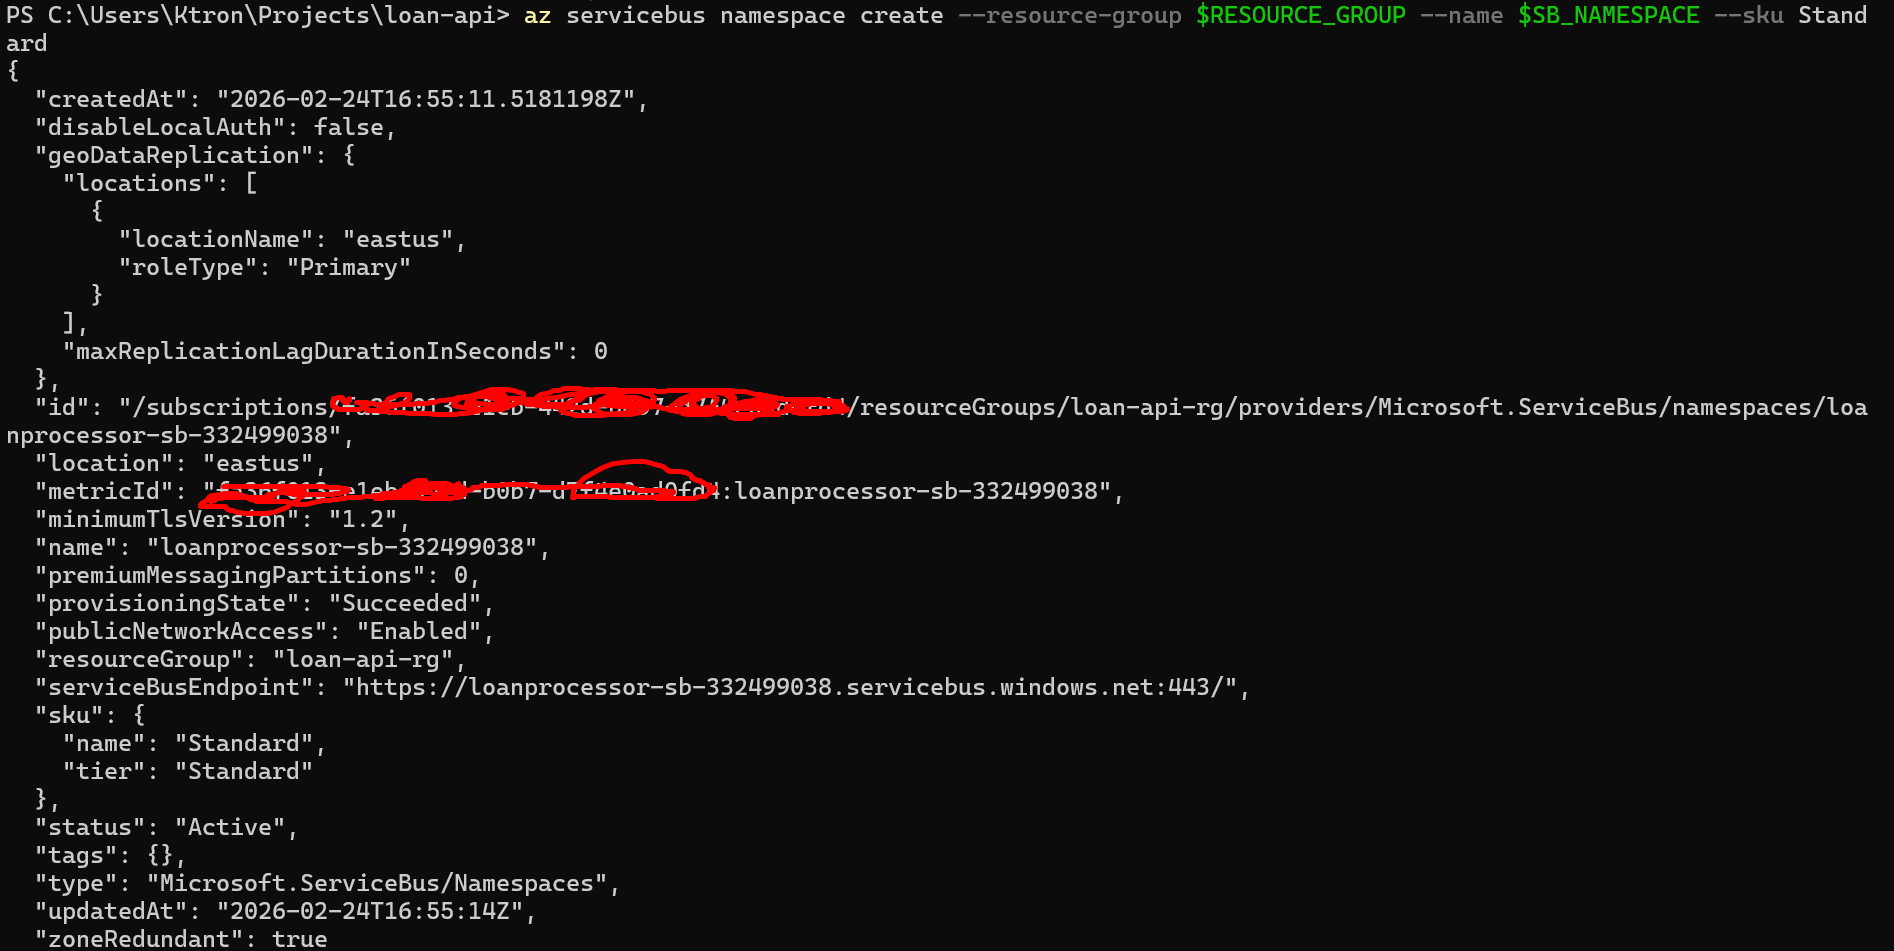
Step 2: Create the Azure Service Bus Namespace and Queue
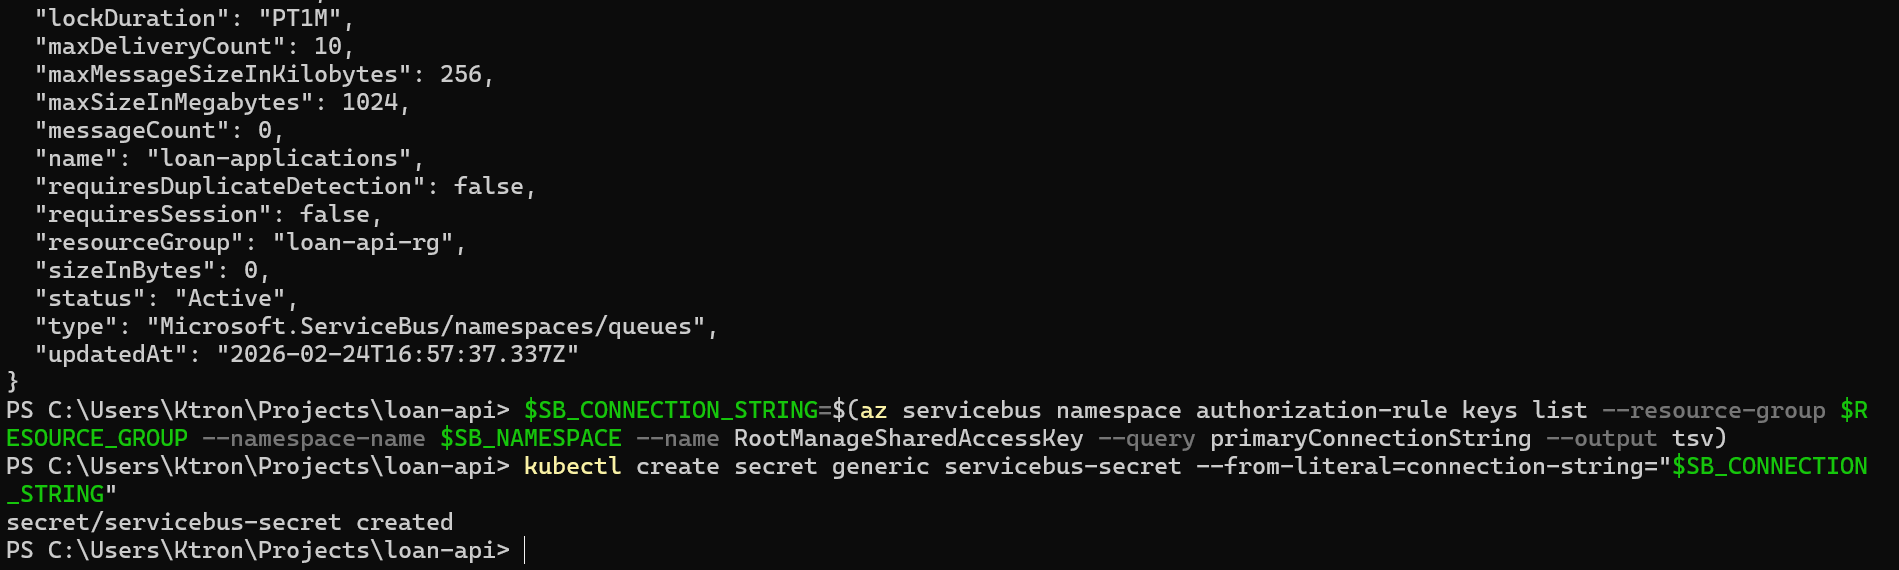
# VariablesSB_NAMESPACE="loanprocessor-sb-$RANDOM" # globally uniqueSB_QUEUE="loan-applications"# Create the Service Bus namespace (Standard tier supports queues)az servicebus namespace create --resource-group $RESOURCE_GROUP --name $SB_NAMESPACE --sku Standard# Create the queueaz servicebus queue create --resource-group $RESOURCE_GROUP --namespace-name $SB_NAMESPACE --name $SB_QUEUE# Get the connection string — we'll store this as a Kubernetes secretSB_CONNECTION_STRING=$(az servicebus namespace authorization-rule keys list --resource-group $RESOURCE_GROUP --namespace-name $SB_NAMESPACE --name RootManageSharedAccessKey --query primaryConnectionString --output tsv)echo "Connection string captured ✓"
Step 3: Store the Connection String as a Kubernetes Secret
Never hardcode connection strings in YAML. Store them as Kubernetes Secrets:
kubectl create secret generic servicebus-secret --from-literal=connection-string="$SB_CONNECTION_STRING"
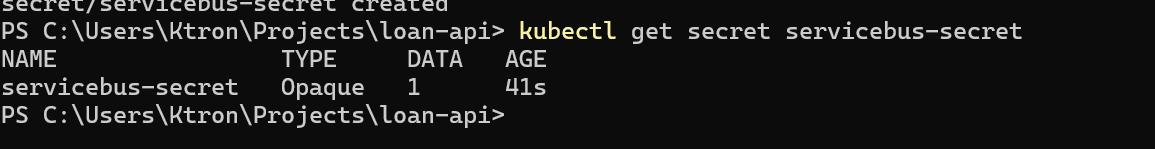
Verify it was created:
kubectl get secret servicebus-secret
Step 4: Deploy the Loan Processor
This is a separate deployment from our loan-api. It simulates picking up messages and processing them (credit scoring, risk analysis, etc.).
Create k8s/loan-processor-deployment.yaml:
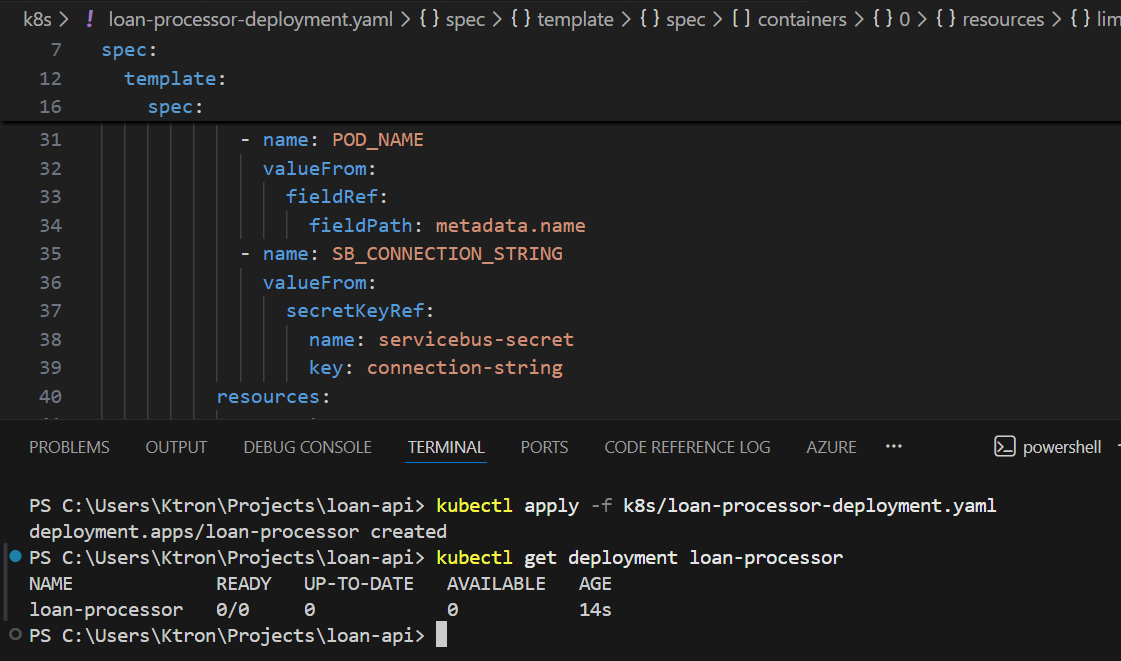
apiVersion: apps/v1kind: Deploymentmetadata: name: loan-processor labels: app: loan-processorspec: replicas: 0 # KEDA will control this — start at 0 selector: matchLabels: app: loan-processor template: metadata: labels: app: loan-processor spec: containers: - name: loan-processor image: busybox:1.28 # Simulates a processor — replace with real image in production command: - /bin/sh - -c - | echo "Loan processor started — pod: $POD_NAME" # In real life: connect to Service Bus, pull messages, run credit checks while true; do echo "Processing loan applications..." sleep 10 done env: - name: POD_NAME valueFrom: fieldRef: fieldPath: metadata.name - name: SB_CONNECTION_STRING valueFrom: secretKeyRef: name: servicebus-secret key: connection-string resources: requests: cpu: "100m" memory: "64Mi" limits: cpu: "300m" memory: "128Mi"
Apply it:
kubectl apply -f k8s/loan-processor-deployment.yaml# Confirm it starts at 0 replicas (as configured)kubectl get deployment loan-processor# READY: 0/0 — correct, KEDA will bring it up when there are messages
Step 5: Create the KEDA ScaledObject for Service Bus
The ScaledObject is KEDA’s primary resource. It wires your deployment to an event source.
Create k8s/keda-servicebus-scaler.yaml:
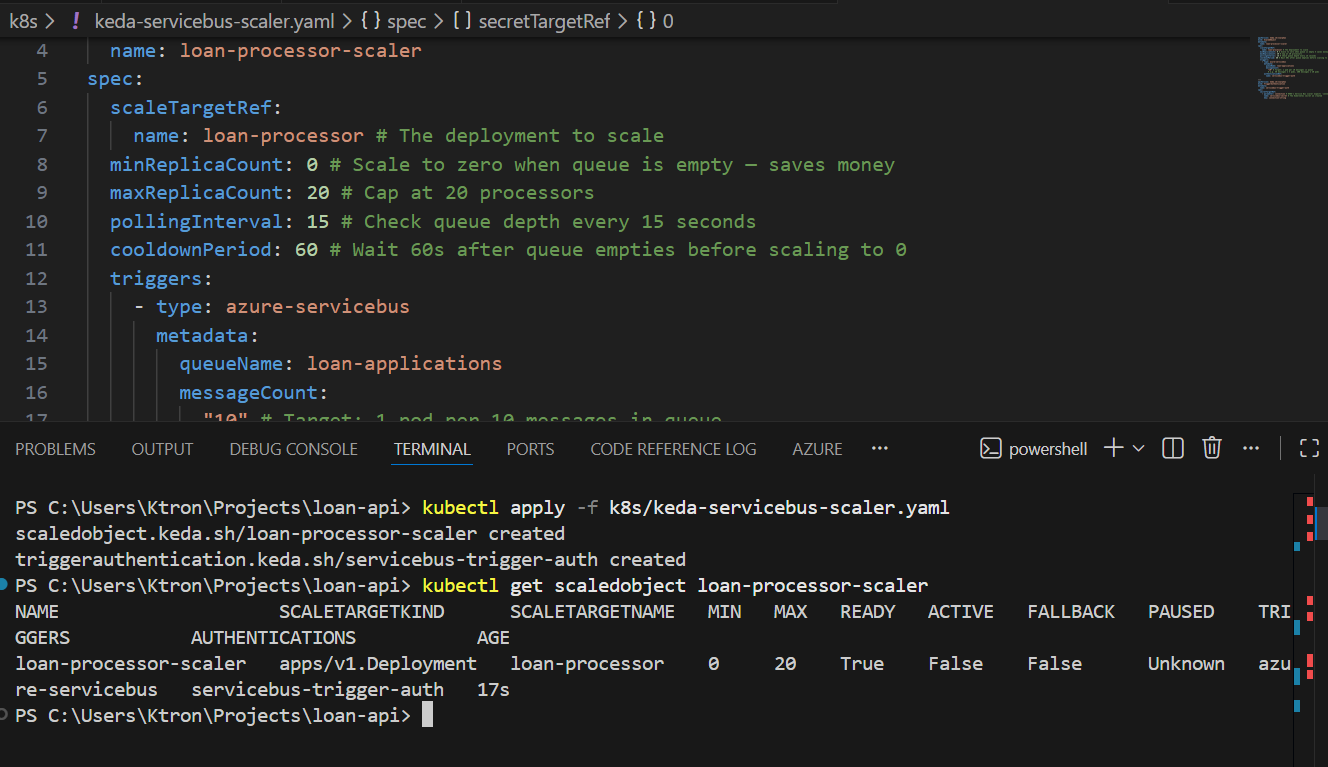
apiVersion: keda.sh/v1alpha1kind: ScaledObjectmetadata: name: loan-processor-scalerspec: scaleTargetRef: name: loan-processor # The deployment to scale minReplicaCount: 0 # Scale to zero when queue is empty — saves money maxReplicaCount: 20 # Cap at 20 processors pollingInterval: 15 # Check queue depth every 15 seconds cooldownPeriod: 60 # Wait 60s after queue empties before scaling to 0 triggers: - type: azure-servicebus metadata: queueName: loan-applications messageCount: "10" # Target: 1 pod per 10 messages in queue # e.g. 50 messages → 5 pods, 200 messages → 20 pods authenticationRef: name: servicebus-trigger-auth---apiVersion: keda.sh/v1alpha1kind: TriggerAuthenticationmetadata: name: servicebus-trigger-authspec: secretTargetRef: - parameter: connection # KEDA's Service Bus scaler expects 'connection' name: servicebus-secret # The Kubernetes secret we created key: connection-string
Apply it:
kubectl apply -f k8s/keda-servicebus-scaler.yaml
Verify KEDA registered it:
kubectl get scaledobject loan-processor-scaler
NAME SCALETARGETKIND SCALETARGETNAME MIN MAX TRIGGERS READY ACTIVEloan-processor-scaler apps/Deployment loan-processor 0 20 azure-servicebus True False
ACTIVE: False means the queue is empty and we’re sitting at 0 pods.
Step 6: Simulate Messages Flooding the Queue
Now let’s send a burst of loan applications to the queue and watch KEDA react:
# Send 50 messages to simulate a wave of loan applicationsfor i in $(seq 1 50); do az servicebus queue message send --resource-group $RESOURCE_GROUP --namespace-name $SB_NAMESPACE --queue-name $SB_QUEUE --body "{\"applicationId\": \"APP-$i\", \"amount\": 50000, \"term\": 360}"doneecho "50 loan applications sent to queue ✓"
Watch KEDA detect the messages and spin up processors (within 15 seconds):
kubectl get scaledobject loan-processor-scaler --watch
NAME READY ACTIVE FALLBACK PAUSEDloan-processor-scaler True False Unknown Unknownloan-processor-scaler True True Unknown Unknown ← queue detected!
kubectl get deployment loan-processor --watch
NAME READY UP-TO-DATE AVAILABLEloan-processor 0/0 0 0loan-processor 0/5 5 0 ← KEDA scaling up!loan-processor 5/5 5 5 ← 5 processors running
5 pods for 50 messages — exactly the messageCount: "10" ratio we configured. If more messages pile up, more pods appear. When the queue drains, they scale back to 0.
Scaler 2: HTTP Request Rate
The Scenario
Our loan-api handles synchronous HTTP requests. Rather than waiting for CPU to spike (which is reactive and lags behind traffic), we want to scale based on requests per second hitting the service, a much more direct signal.
Note: KEDA’s HTTP add-on is a separate install from the core KEDA operator. It’s currently in preview but fully functional.
Step 7: Install the KEDA HTTP Add-on
# Add the KEDA HTTP add-on via Helmhelm repo add kedacore https://kedacore.github.io/chartshelm repo updatehelm install http-add-on kedacore/keda-add-ons-http --namespace keda --create-namespace
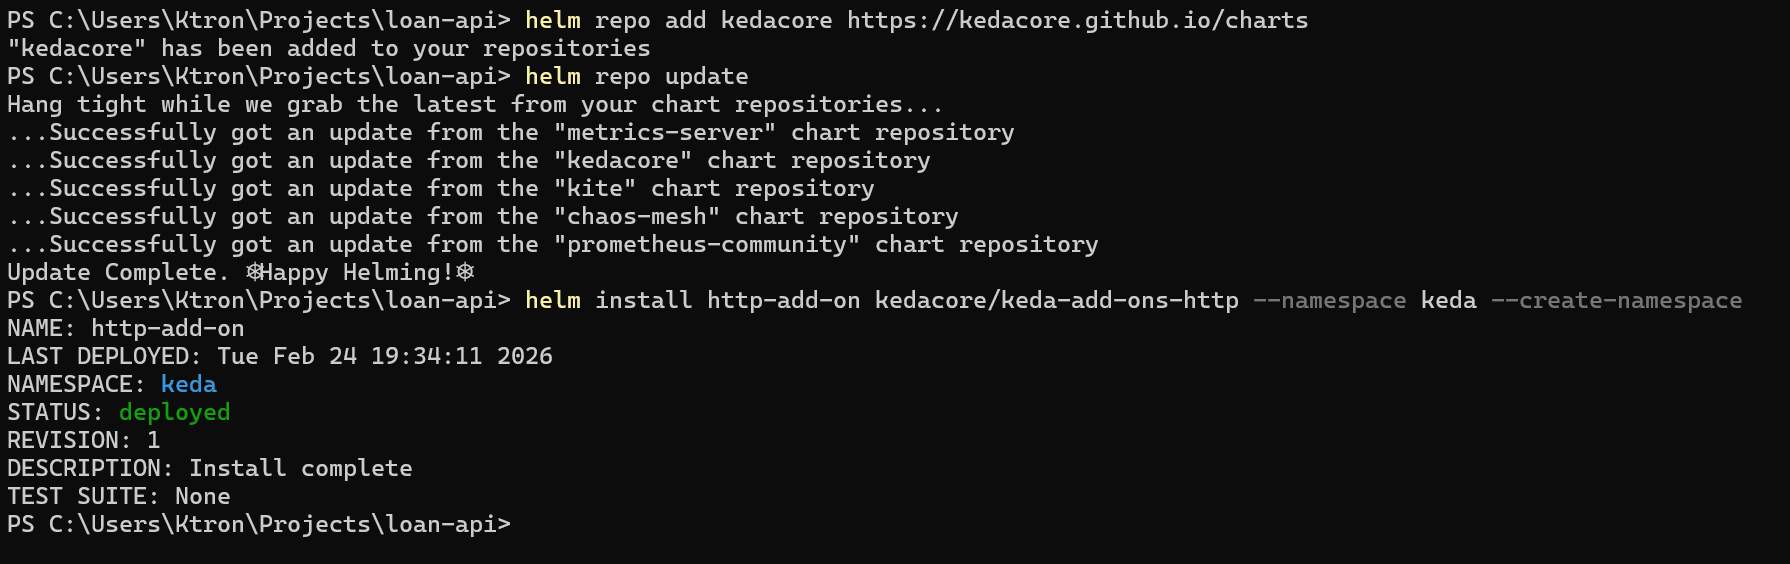
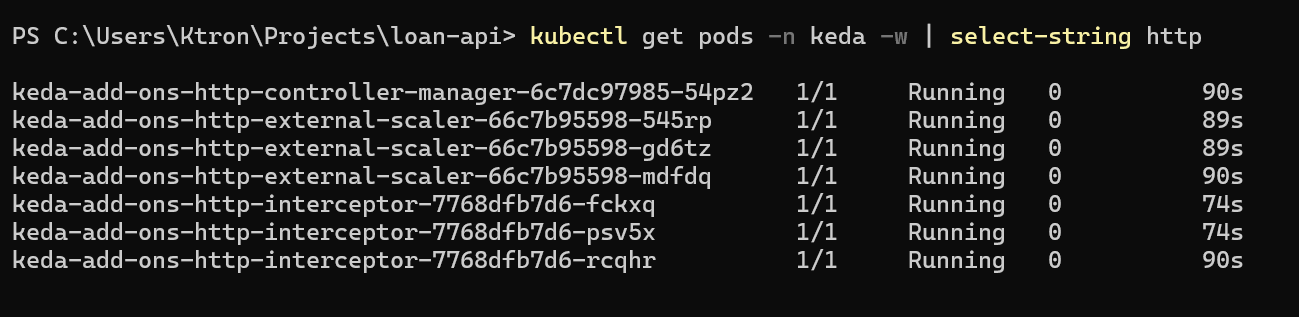
Verify the HTTP add-on pods are running:
kubectl get pods -n keda | grep http
keda-add-ons-http-controller-manager-xxx 1/1 Running 0 60skeda-add-ons-http-interceptor-xxx 1/1 Running 0 60s
Step 8: Create an HTTPScaledObject for the Loan API
The HTTP add-on uses a different resource type: HTTPScaledObject. It works by routing traffic through an interceptor proxy that counts requests, then feeds that count to KEDA for scaling decisions.
Create k8s/keda-http-scaler.yaml:
kind: HTTPScaledObjectapiVersion: http.keda.sh/v1alpha1metadata: name: loan-api-http-scalerspec: hosts: - localhost # For local/demo use; replace with real hostname in prod scaleTargetRef: name: loan-api # Deployment name kind: Deployment apiVersion: apps/v1 service: loan-api # ← this was missing — must match your Service name port: 3000 # Port exposed on the Service replicas: min: 1 max: 15 scaledownPeriod: 300 # Seconds to wait before scaling down (replaces scalingMetric.window) scalingMetric: requestRate: granularity: 1s targetValue: 30 window: 60s
Apply it:
kubectl apply -f k8s/keda-http-scaler.yaml

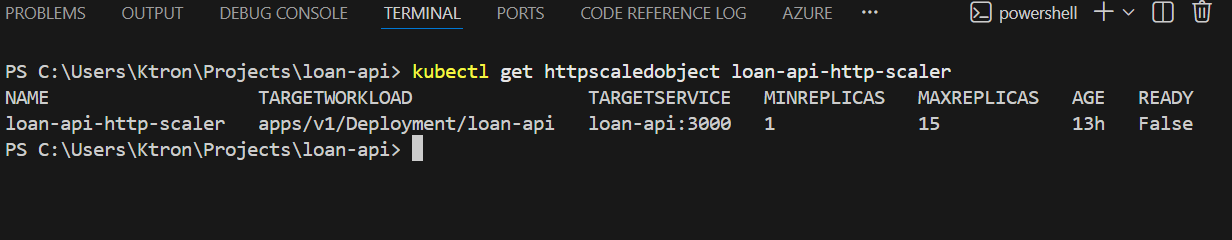
Check its status:
kubectl get httpscaledobject loan-api-http-scaler
Step 9: Generate HTTP Load and Observe
Run a sustained load test using the load generator pod:
# Generate ~100 requests/second for 2 minuteskubectl run http-load \ --image=busybox:1.28 \ --restart=Never \ -it \ -- /bin/sh -c " for i in \$(seq 1 120); do for j in \$(seq 1 10); do wget -q -O- http://loan-api.default.svc.cluster.local/calculate & done sleep 1 done wait "
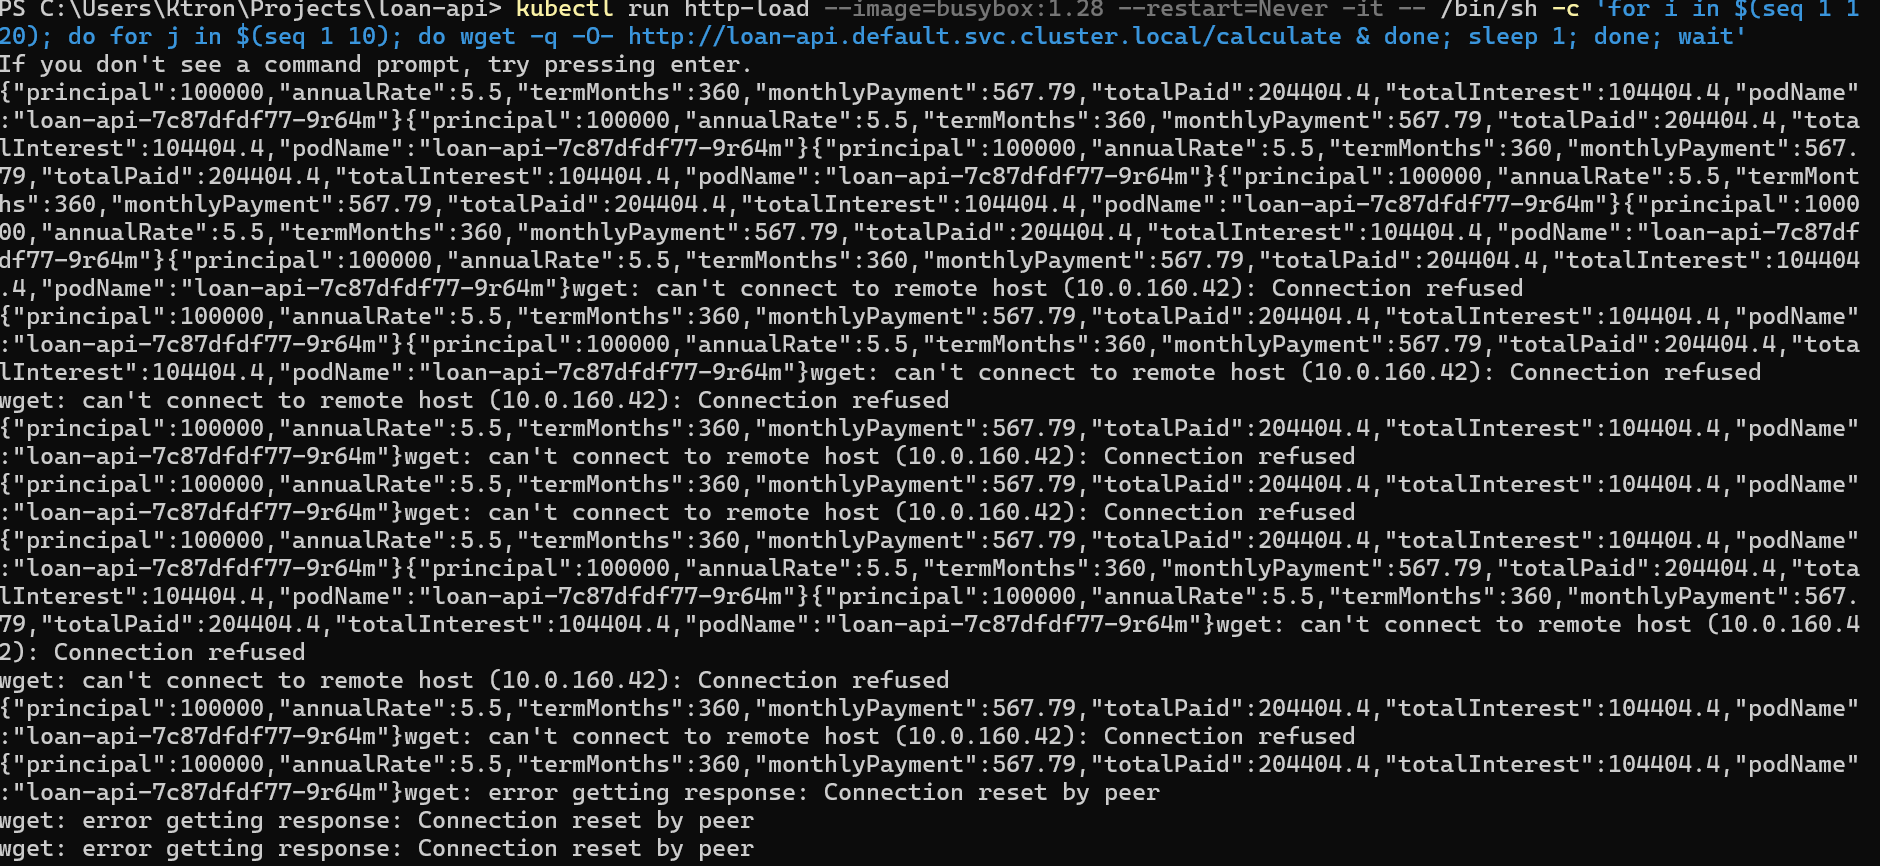
Watch loan-api pods multiply:
kubectl get pods -l app=loan-api --watch
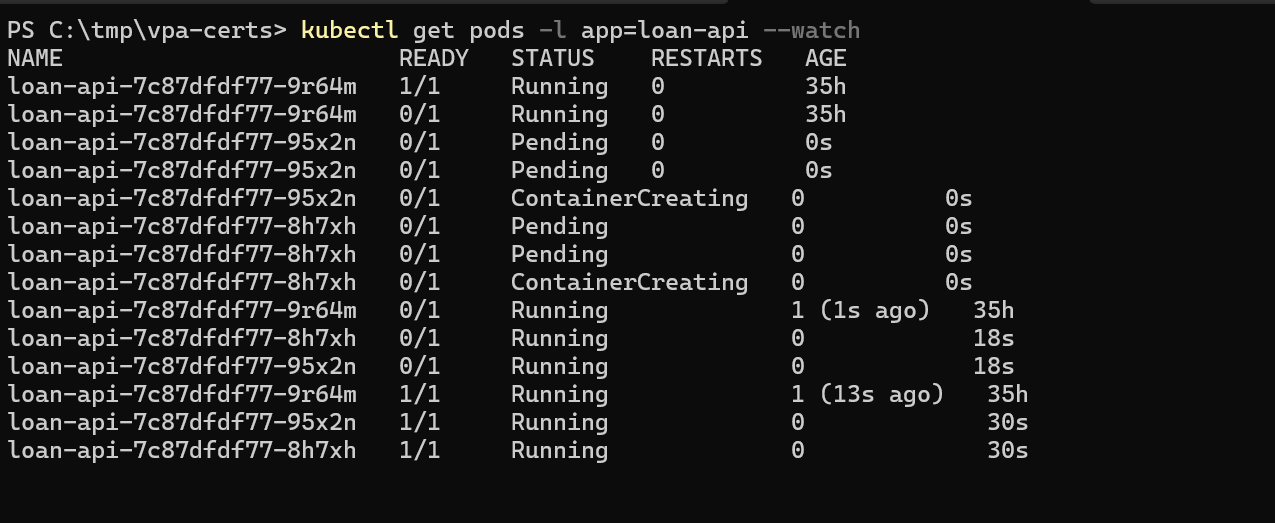
The HTTP add-on counts requests per second across all pods, computes the per-pod average, and scales up if it exceeds your 30 req/s target.
KEDA vs HPA: When to Use Which
| Signal | Use HPA | Use KEDA |
|---|---|---|
| CPU utilization | Native | Works too |
| Memory utilization | Native | Works too |
| Queue depth (Service Bus, SQS, etc.) | Not supported | Built-in |
| HTTP requests per second | Not supported | HTTP add-on |
| Custom Prometheus metric | Needs adapter | Built-in |
| Scale to zero | Min 1 pod | Supported |
| Async/batch workloads | Poor fit | Ideal |
| Simple, stateless web APIs | Good enough | More control |
The rule of thumb: start with HPA for simple stateless services. Reach for KEDA the moment your scaling signal comes from outside the pod itself a queue, an external API, a business metric, or a schedule.
Cleanup
# Remove KEDA ScaledObjectskubectl delete scaledobject loan-processor-scalerkubectl delete scaledobject loan-api-prometheus-scalerkubectl delete httpscaledobject loan-api-http-scaler# Remove the processor deployment and secretkubectl delete deployment loan-processorkubectl delete secret servicebus-secret# Remove Service Bus resourcesaz servicebus namespace delete \ --resource-group $RESOURCE_GROUP \ --name $SB_NAMESPACE# Disable KEDA add-on (optional — keep it if you're continuing the series)az aks update \ --resource-group $RESOURCE_GROUP \ --name $AKS_CLUSTER \ --disable-keda
Key Takeaways
KEDA is an HPA with superpowers. It uses the same underlying HPA machinery but feeds it metrics from 50+ external sources, queues, streams, HTTP traffic, Prometheus, cron schedules, and more.
Scale-to-zero is a game changer for async workloads. A loan processor that sits at 0 pods when there’s nothing to do costs nothing. HPA can’t do this, KEDA can.
Multiple triggers give you defense in depth. Rather than picking one scaling signal and hoping it’s the right one, define several. KEDA takes the most demanding one and uses that to set the replica count.
The HTTP add-on is in the preview plan accordingly. For production HTTP scaling, consider using Prometheus-based scaling with an NGINX or Istio metrics instead, which is more battle-tested.


Leave a comment